
Breaking Up is Easy – Splitting Up Time and Year in Reporting
Written By: Ryann Hristovsky
Many of our clients come from a product that had Month/Week and Year in two separate dimensions. This made it easy to pivot one into rows and another into columns and view trends in a summarized view. I came from the Hyperion world and this change took some getting used to for me as well.
Let us dive right into the use case, my co-worker called me the other day with this reporting question. Is it possible for me to show the year in the rows and the month in the columns?
I thought about this for a second, not thinking this was something that could be done easily and almost got off the phone. But something told me I was wrong; I had done this before. I had almost forgotten, which was a clear case for me to document this for all of you (and for me in six months when how to do this is all but a hazy memory of implementations past).
Before we get into the how to I have to make a quick confession here, the first time a client asked for this I built a report using XFGet formulas instead of a Cube View. (I know… the shame, always strive to be better.)
What is an Override?
This is a prime example of when it is appropriate to use Cube View overrides. Overrides allow you to enter a member filter that trumps the one in the row or column. You will access the Column Override on the Row line and vice versa, as this is describing what you are overriding. Note that you are limited to four of each, so if you need more than four years of historical data you will need to discuss alternative options.
Cube View Set Up
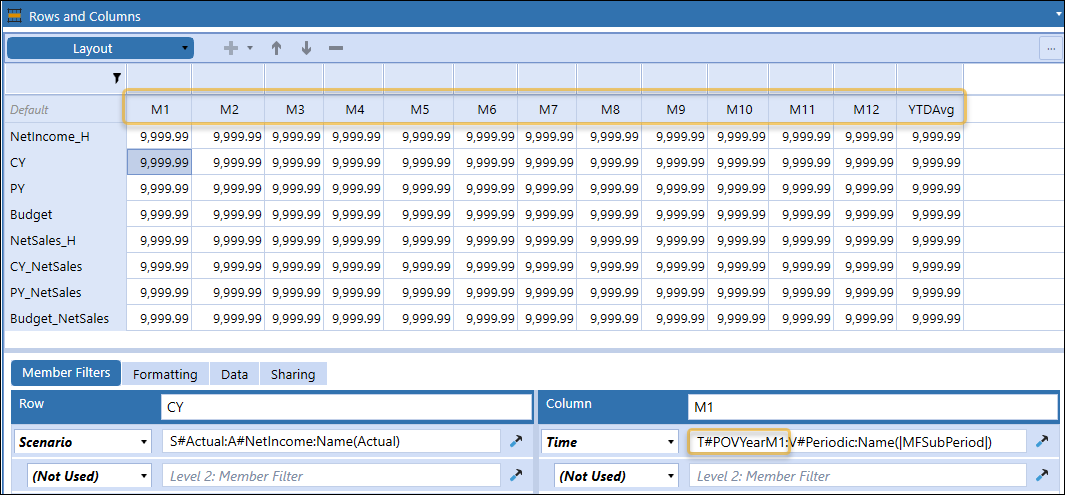
Due to the nature of these overrides you will need to set up your Cube View with a different column for each period. In my Cube View Columns below I have 12 months and a YTD Avg. In the Rows I have the Scenario/Year. In this case I have a header Row, Current Year (CY), Prior Year (PY), and Budget Row for each account. My CY and Budget will be the same year, so I just need to use one Override for the PY Rows.
Column Vs. Row
You have the option of using Row and Column Overrides. If you look at your Column Overrides here you will realize that this will not work, as you will run out of Overrides after you get to Month 4. This is why we set our Cube View up as 13 Columns. Click on your M1 column and go to the Row Overrides tab. Here you will need to enter two things: the Row Range which will be the row names that you want to override and a member filter. Note, you can use a comma separated list here if you have multiple rows that need the same year assignment.
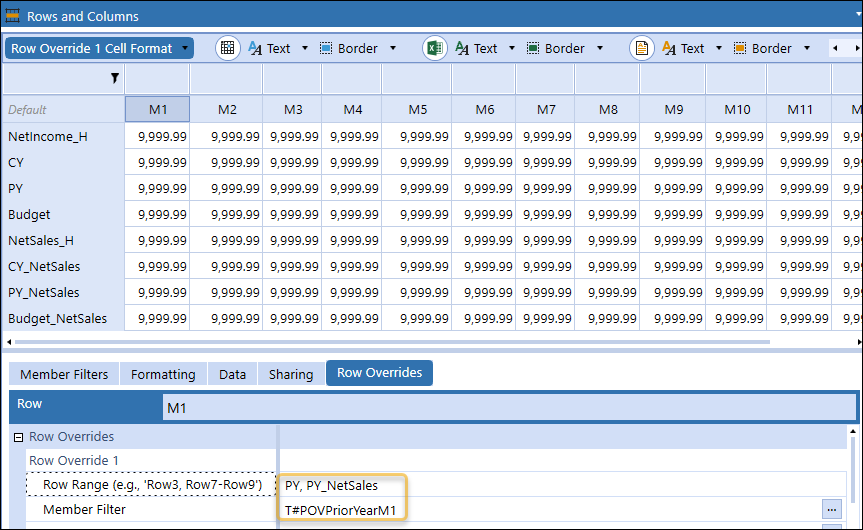
I used T#POVPriorYearM1 here, you could also use a member filter to tie to your Workflow: T#YearPrior1(|WFTime|)M1
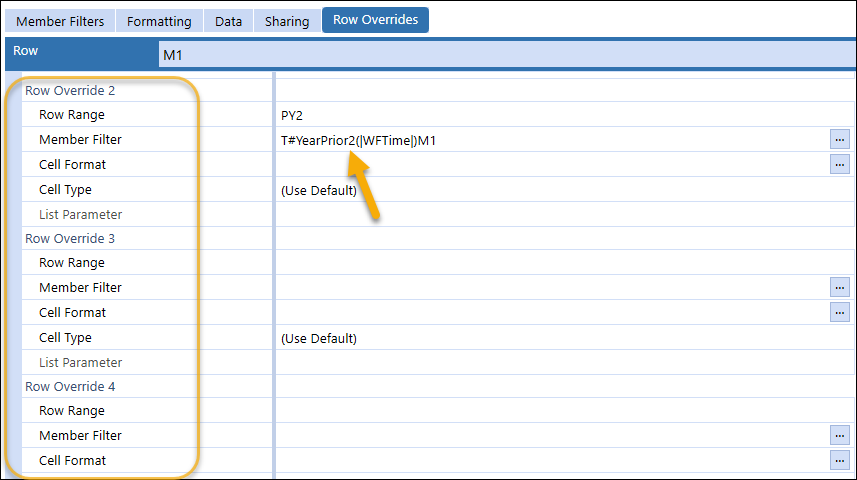
You will need to do this for each column. If you have rows going back multiple years you can use Row Overrides 2-4 as well to go back a different number of years. Just change the number after YearPrior in your member filter.
Dynamic Naming
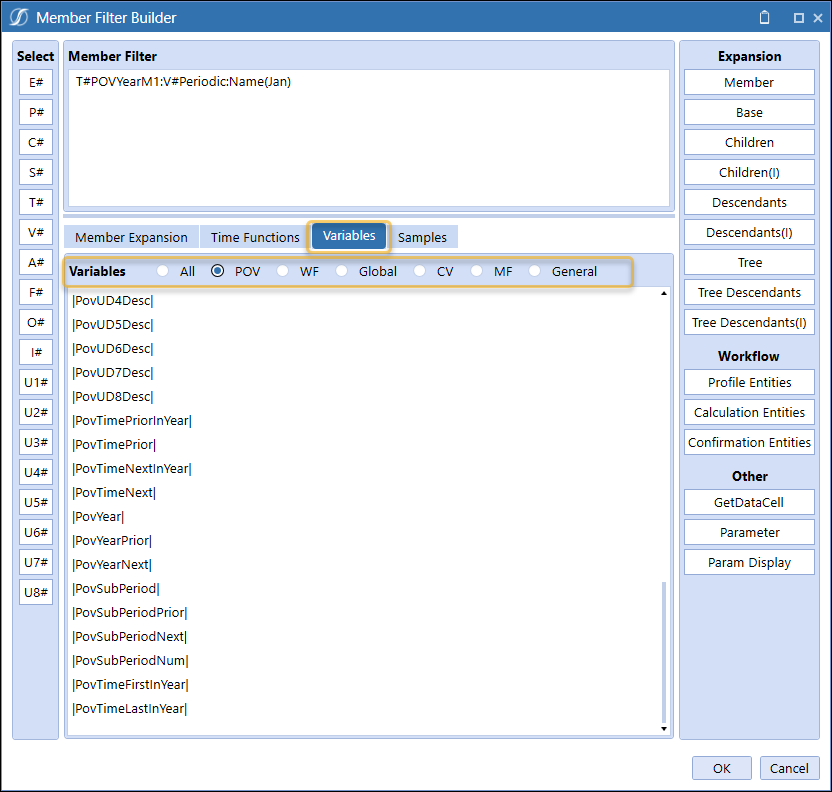
OneStream offers several out of the box Substitution Variables that let you use dynamic naming conventions. If you are not familiar with these, they can be viewed by going to the Member Filter Builder and selecting the Variables tab. You can then filter by the type of Variable you are looking for, I selected POV. These can also be accessed within the application using the Object Lookup button (the glasses icon).
To make your row names update dynamically with the year I named my rows using the following conventions. T:xxxx:Name(Actual |PovYear|) and T:xxxx:Name(Actual |PovYearPrior|)
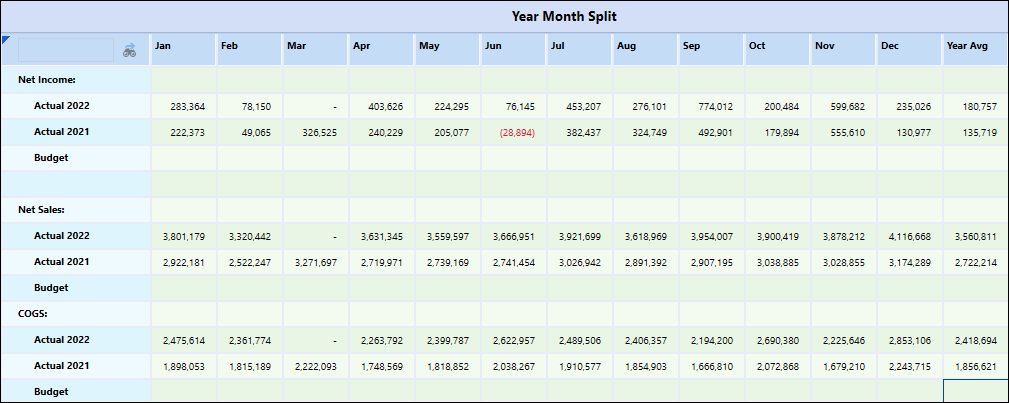
Final Results: aka the Breakup
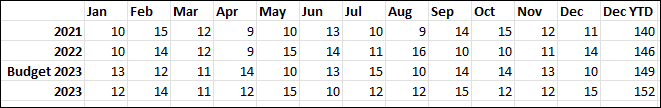
Set this up and make it dynamic by referencing a Workflow or POV so you only have this one time overhead. When you run your Cube View you will get your Year and Months split out. Simple but unintuitive.
Hopefully this adds a new report format to your OneStream toolbox!