
If you’ve read any of our past blog posts, you know we’re not afraid to get into the weeds, business rules, advanced dashboards, parameterized Excel reports, you name it. But sometimes you need to take a step back. This post? We’re going back to basics.
Whether you’re brand new to OneStream or just looking for a refresher, this post is for you. A Cube View is one of the most fundamental reporting tools in OneStream, it’s a flexible, customizable grid that lets you view and analyze financial data across dimensions like Account, Entity, Time, and Scenario. Think of it as designing a report: you define the context (your Point of View), set up the structure (rows and columns), and let the data flow in.
No business rules. No code. Just the building blocks. Let’s get into it.
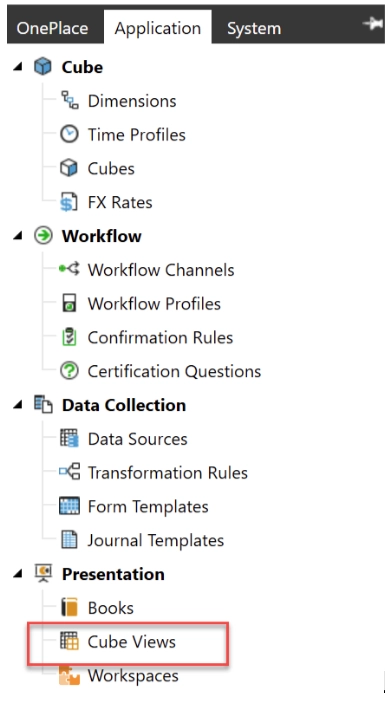
Navigate to Cube Views
Go to Application > Cube Views.
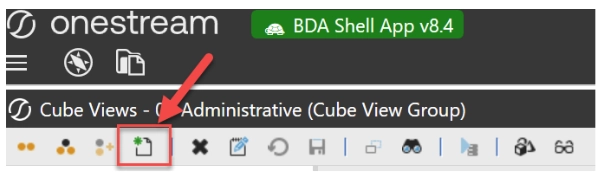
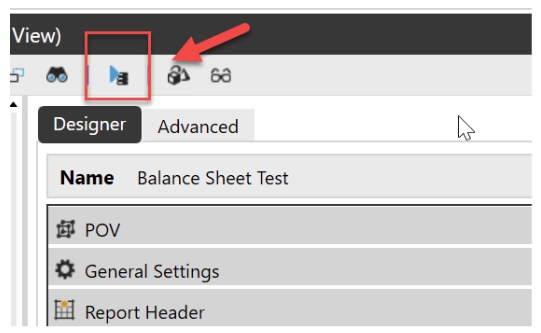
Create New Cube View
Click the icon to create a new Cube View.
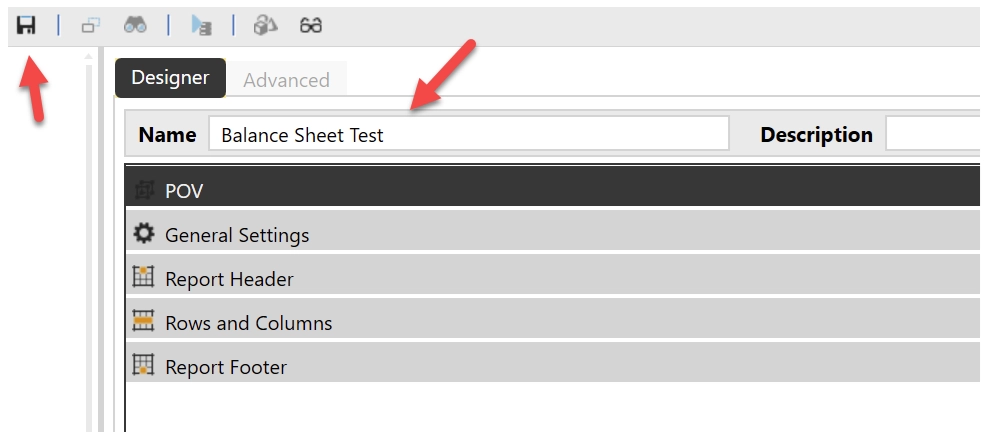
Define Properties
Enter a Name and Description for your Cube View then press save.
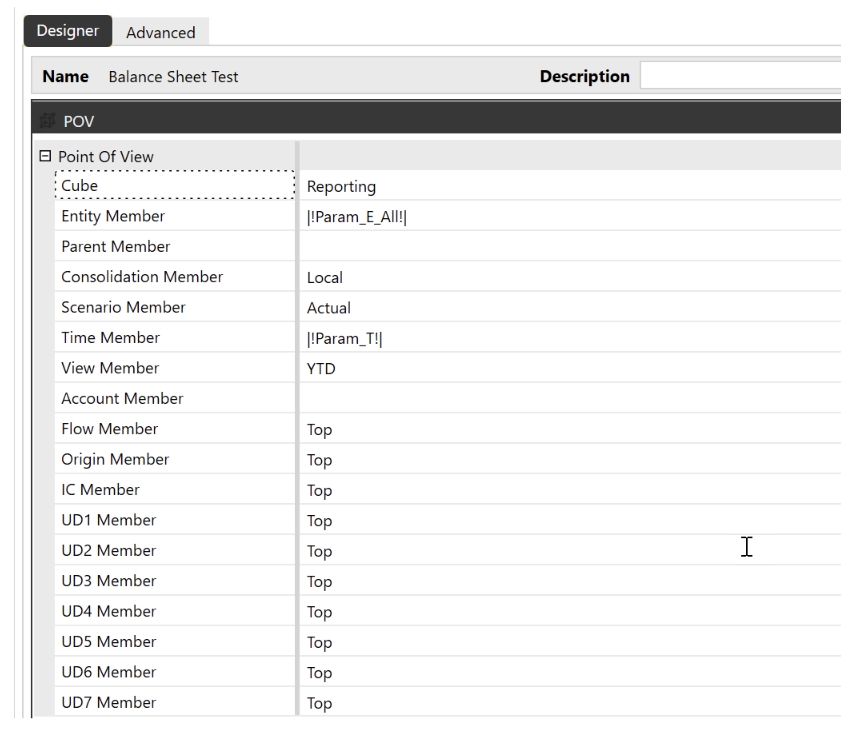
Set Point of View (POV)
Understanding POV (Point of View):
The POV acts like filters at the top of your report and defines the context of your data. For example, selecting Scenario (Actual vs Budget) or Time (Month/Year). Parameters in the POV allow end users to dynamically choose values when running the Cube View.
What is a Parameter in the POV?
A parameter is a prompt that allows the end user to choose a value when they run the Cube View.
Instead of hardcoding a specific member (e.g., a single Entity or Time period), you can set it as a parameter so the user can select it dynamically.
For example:
– Instead of fixing Entity = ‘USA’, you can create a parameter so the user selects the Entity at runtime
– Instead of fixing Time = ‘Jan 2026’, the user can choose the period they want to view
This makes your Cube View more flexible and reusable across different users and reporting needs.
Understanding Member Filters:
Member Filters define which members appear in your Cube View. Instead of manually selecting members, you can use dynamic filters such as Descendants to automatically include all relevant data. This keeps your Cube View flexible and easier to maintain.
Select key dimensions such as Cube, Entity, Scenario, and Time.
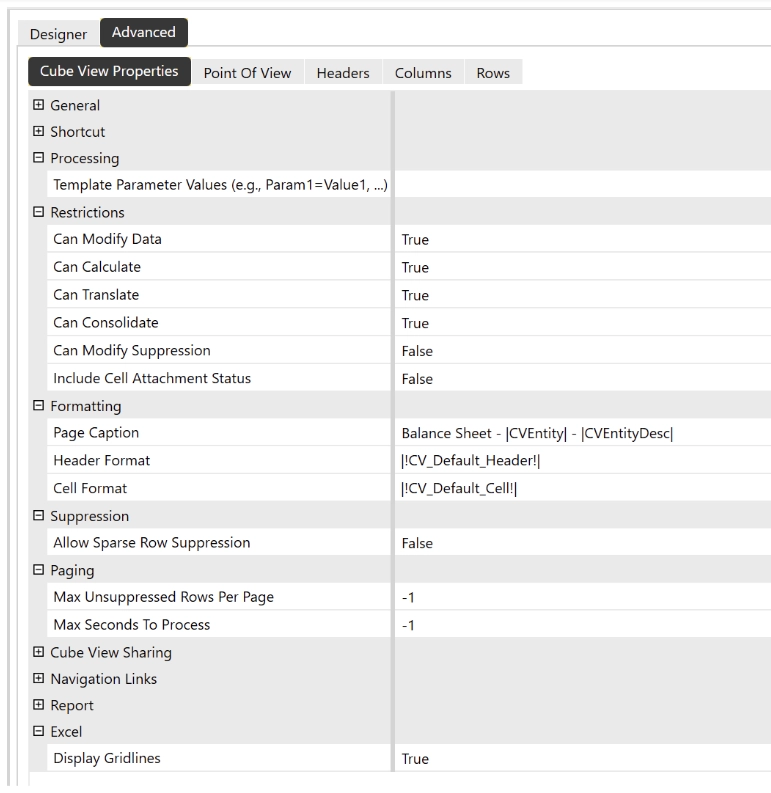
Set Cube View Properties
Set Cube View Properties by clicking the plus next to each heading.
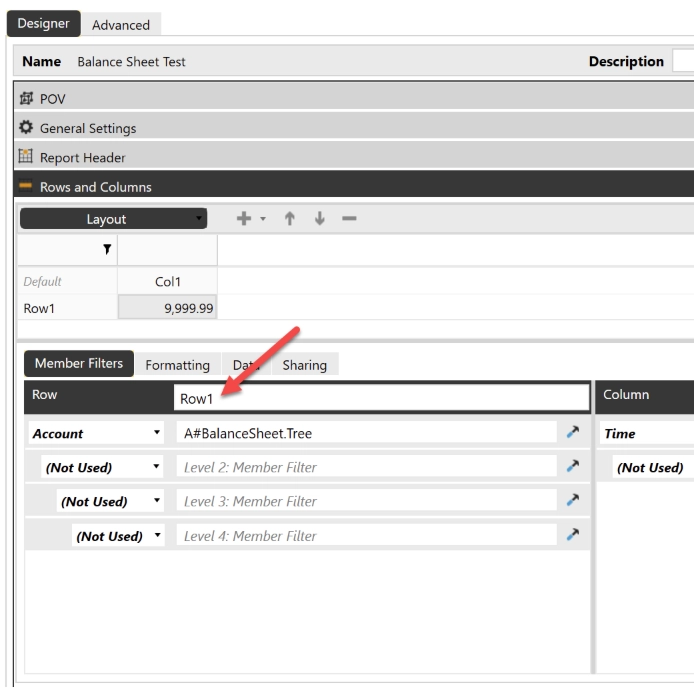
Configure Rows and Columns:
Understanding Rows and Columns:
Rows determine what data is listed (e.g., accounts in a Balance Sheet), while columns define how the data is displayed (e.g., by time or entity). Together, they form the structure of your report.
Define the row structure and select account members (e.g., Balance Sheet). The rows can be configured either in the Designer or Advanced tab. You can also put a name description in the row.
Use Member Filters to dynamically pull data (e.g., BalanceSheet.Tree).
Define the column structure (e.g., Time or Entity). The columns can be configured either in the Designer or Advanced tab. You can also put a name description in the column.
Use Member Filters to dynamically pull data.
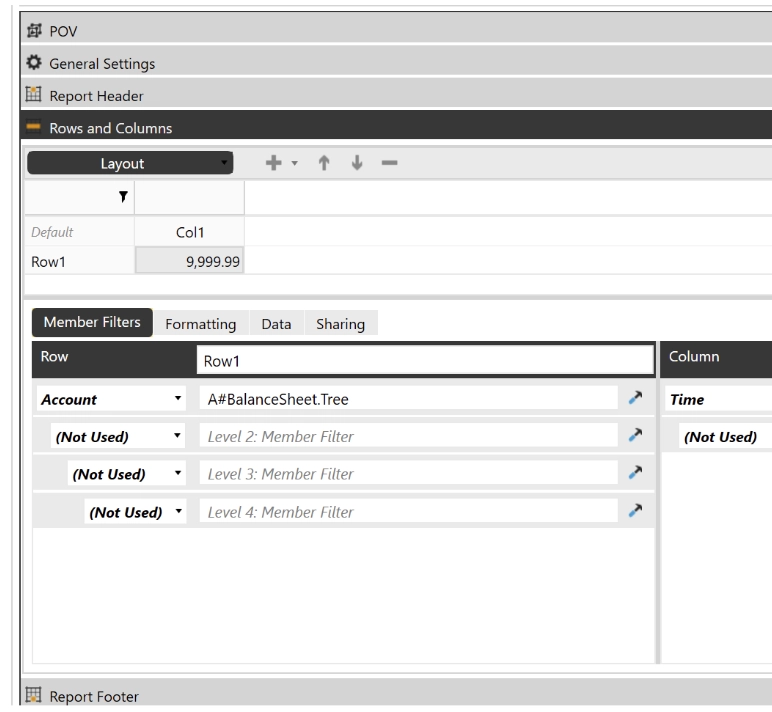
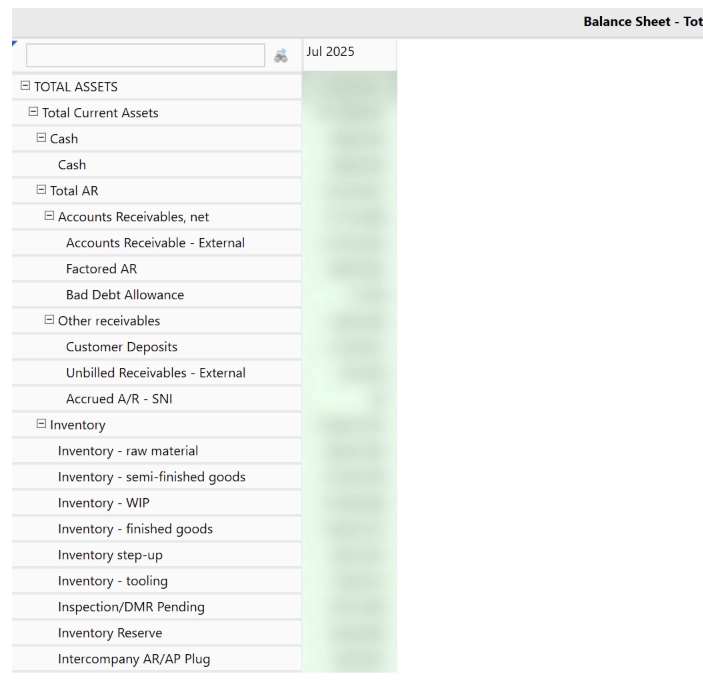
Review Layout
Validate the layout and preview the data grid.
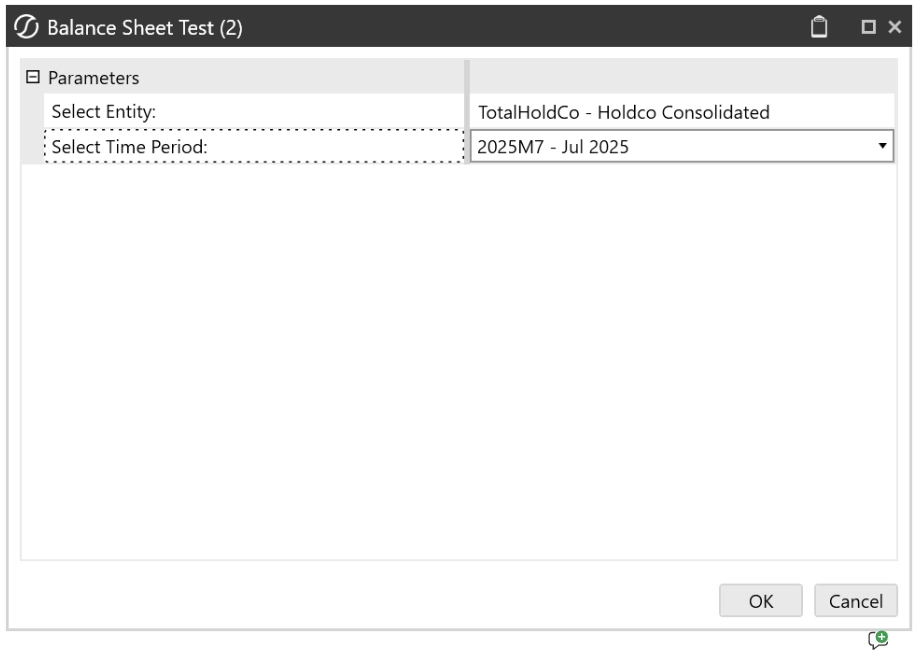
Final Cube View
Choose values for prompts. Confirm the Cube View displays correctly for end users.
Tips & Common Mistakes
Before you go off and start building, here are a few things I’ve learned the hard way:
- Always double-check your POV selections before you start adding rows and columns. A wrong default here will throw off your entire report, and you’ll spend way too long figuring out why.
- Use Descendants filters whenever you can, they keep your Cube View dynamic so you’re not manually updating it every time a new member gets added.
- If your data looks like it’s missing, check your suppression settings first. Nine times out of ten, that’s the culprit.
Seeing pink cells or a blank grid? It’s almost always a security access issue on one of your dimensions. Confirm that your user has access to the members you’re pulling in.
Wrapping Up
And that’s it, you just built a Cube View from scratch. Not so scary, right? This is the foundation that everything else builds on. Once you’re comfortable here, you’ll be ready to tackle POV precedence, linked Cube Views, parameters, and beyond. Stay tuned and happy reporting!