Crafting an end user dashboard interface can be incredibly satisfying and a lot of fun. It can also be a maddening experience when suddenly your page stops rendering and now you have to comb through hundreds of components to find what went wrong. Oh, the emotional roller coaster that OneStream can be. But it’s all worth it (right?)!
If you are creating a dashboard for the first time it can be intimidating. There are so many components and with each there are options when it comes to Formatting, Server Tasks, User Interface Actions, options to attach Data Adapters, the list goes on. Without viewing changes in real time it can be challenging to tell what a setting actually does.
The first dashboard I ever built involved taking an existing dashboard and recreating it piece by piece. While this might sound like an exercise in futility, I would recommend this to anyone that wants to ease into dashboarding. This is a great way to truly understand how components link together to create content. Then once you have a foundation to start upon you now have a playground to change settings and see what they do to your interface. While you’re changing things you have the chance to break things and then painstakingly fix them.
I believe that the best way to learn is to do!
What is Design Mode?
Before you start down this path, I want to make sure you are aware of Design Mode!
Design Mode helps you view the components of your dashboard. You can easily pinpoint and navigate directly to the item you want to edit. To do this, you first click the carrot on the ‘View Dashboard’ button and pick ‘Set Selected Dashboard As Default’.

Then click the blue ‘View Dashboard in Design Mode’ button to run your dashboard in Design Mode.

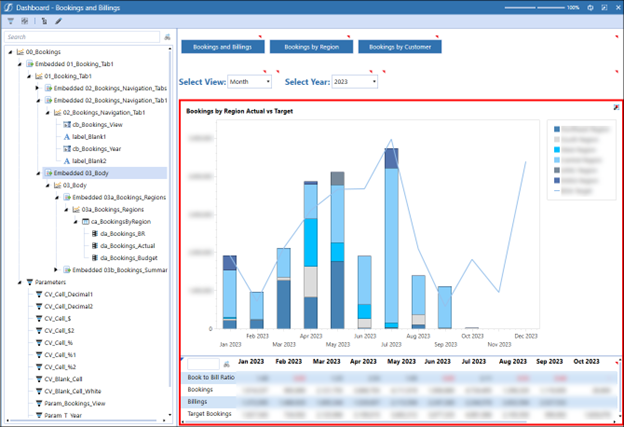
This will display your dashboard, as seen below, allowing you to click on any of the red triangles and see exactly what the item is made up of.
But How Did You Get There?
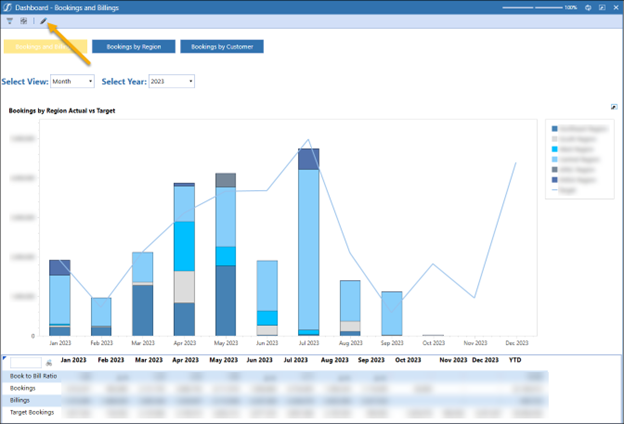
If you are not sure what the name of the dashboard you are looking to edit or review is, from any dashboard page you can click on the ‘Edit Dashboard’ pencil button at the top.
This will navigate you to the exact dashboard component that makes up your dashboard screen.

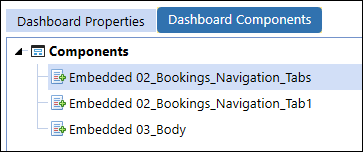
Note that there may be several dashboards embedded in one to make the final content screen. See how the page below consists of three embedded dashboards. Embedded dashboards are components that are automatically created every time you create a dashboard. They allow you to nest dashboards within one another.
What’s With All This Red?
When you display your dashboard in Design Mode you will notice several red indicators. The red triangles indicate that there is a component on which you can click. The red box indicates which item is currently selected. It will also be highlighted in the left panel.
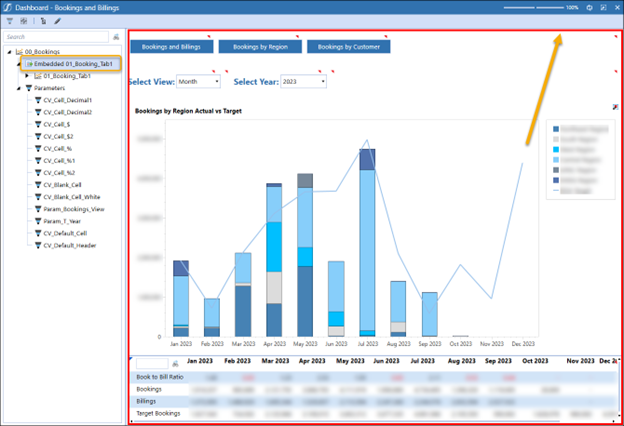
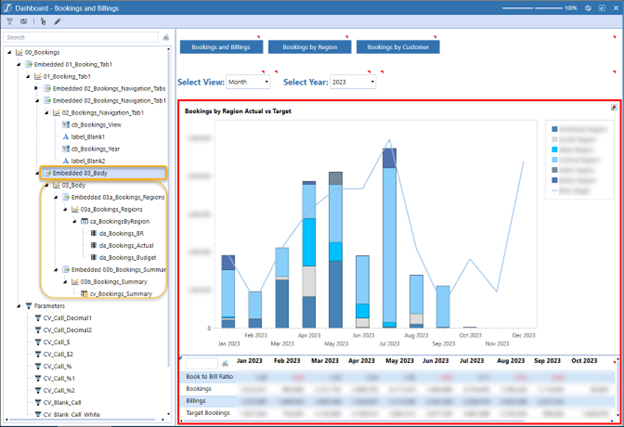
Clicking a different item will change what is highlighted in the panel. By clicking the carrot next to the item, you can drill down to see all the components that make up that item. I can see below that the 03_Body is made up of two embedded dashboards and all the sub-components that each one of those is respectively made up of.
The 03a_Bookings_Regions dashboard is made up of an advanced chart component which has three data adapters attached to it.
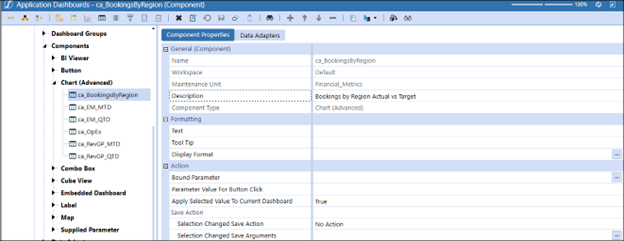
If I want to navigate to my chart to make a change, I can click on the chart item and click the ‘Edit Component’ pencil at the top – this takes me directly back to my item. To get back to Design Mode I can select the tab at the bottom of the screen to switch back.
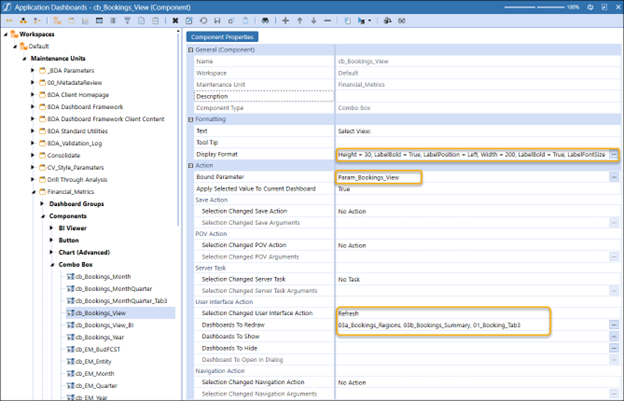
If I need to change the parameter that is driving a combo box or the dashboard page it is refreshing, I can follow the same steps to navigate to that component and make my needed changes.

Is Everything a Dashboard?
OneStream is full of dashboards – MarketPlace Solutions are made up of dashboards and components. Even if you are not new to dashboards, using Design Mode can be helpful to see how items are set up so you know how to utilize them for a future dashboard of your own.
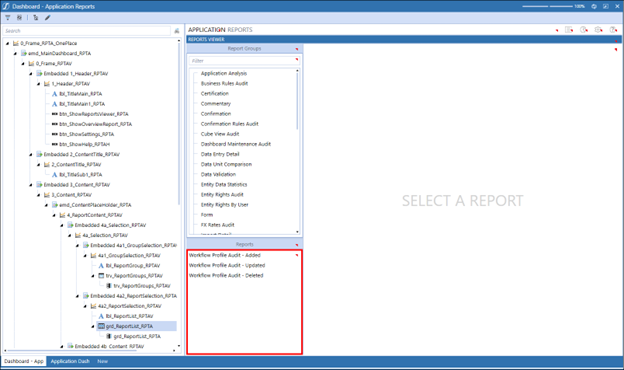
Below is the Application Reports Marketplace Solution in Design Mode. I have used this view to see how items are set up, as well as to make slight changes. One thing to remember with MarketPlace solutions is that if you customize them for a client, your changes may be overridden if an update is done later, so this should be done sparingly if at all.
That’s All Folks
As someone who loves dashboarding I hope this inspires you to get creating. I can’t wait to see what new dashboards you come up with.