

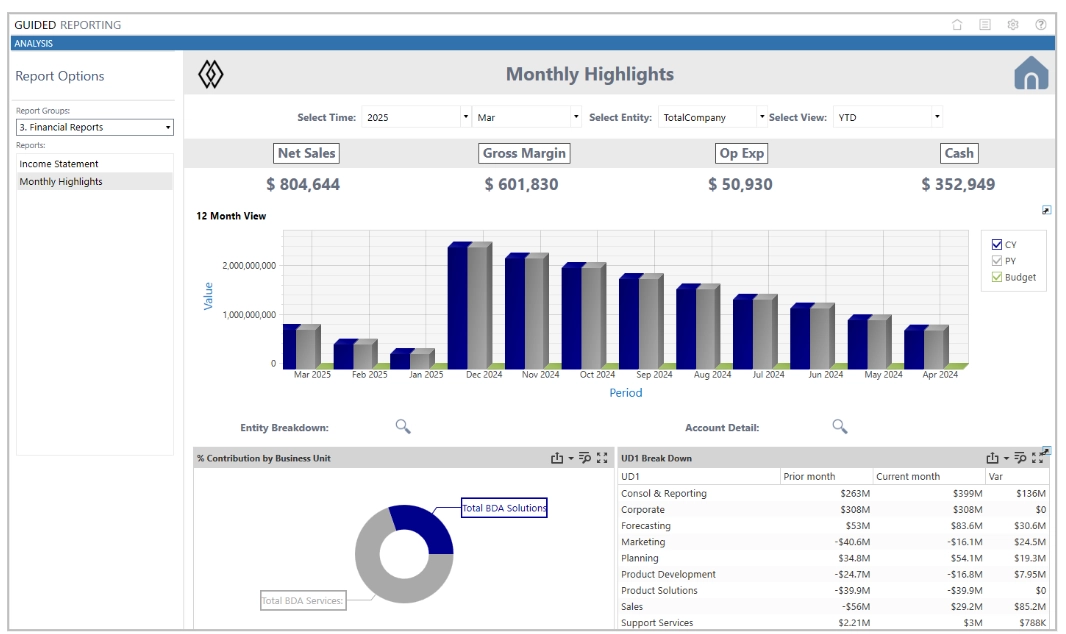
Finding the right report should be the easy part of financial analysis. OneStream Guided Reporting brings Cube Views and Dashboards together on one reporting page, where users can open a report, adjust their selections, and review the results.
The Balance Sheet below shows what that experience looks like. Users can select their entity, reporting period, and currency, then choose a row and column layout. The Income Statement, Cash Flow and Monthly Highlights dashboard are also accessible from the same report group.
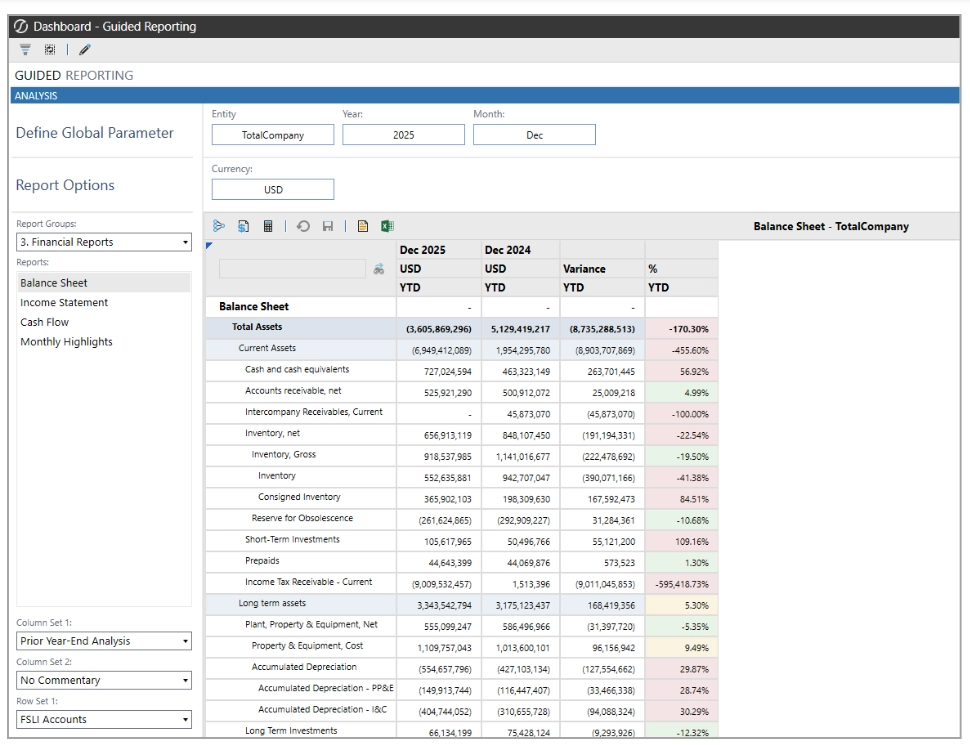
Bringing this experience together starts with a few administrator settings: shared parameters, report groups, and the selections and defaults that make each report easier to use. Let’s start with the shared parameters.
Set Up Shared Parameters and Report Groups
Start with the Show Settings Page, where you configure Global Parameters that can be shared across reports. These are useful for frequent selections such as Currency, Entity, or Time. For each parameter, set a user-friendly List Label, a Default Value, and the order in which it appears.
The parameter must also exist in the underlying Cube Views intended to respond to it. Guided Reporting presents the selection and the Cube View determines what it does.

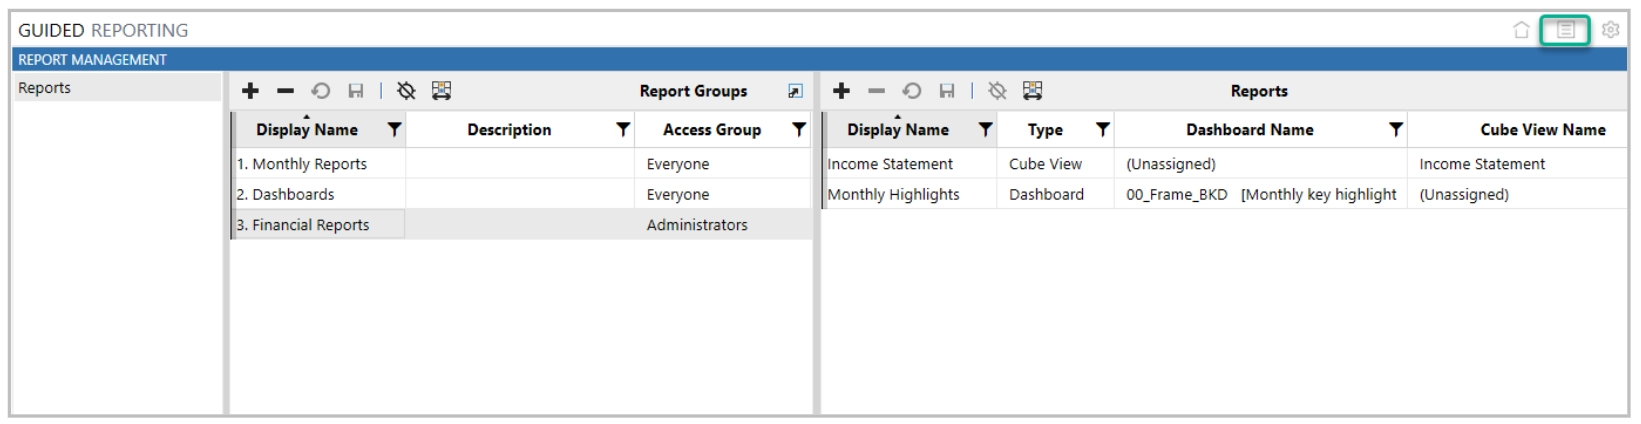
Next, use Report Management to organize Cube Views and Dashboards into logical groups, such as Financial Reporting, Management Reporting, or Tax. Select a group on the left, then add its reports on the right. For each report, set its Display Name, Type, underlying content, Display order, and whether it is enabled.
Security can be assigned at both the report group and individual report level. A user must have access to the group and permission to the underlying Cube View or Dashboard to see the report.
Discover and Configure Parameters
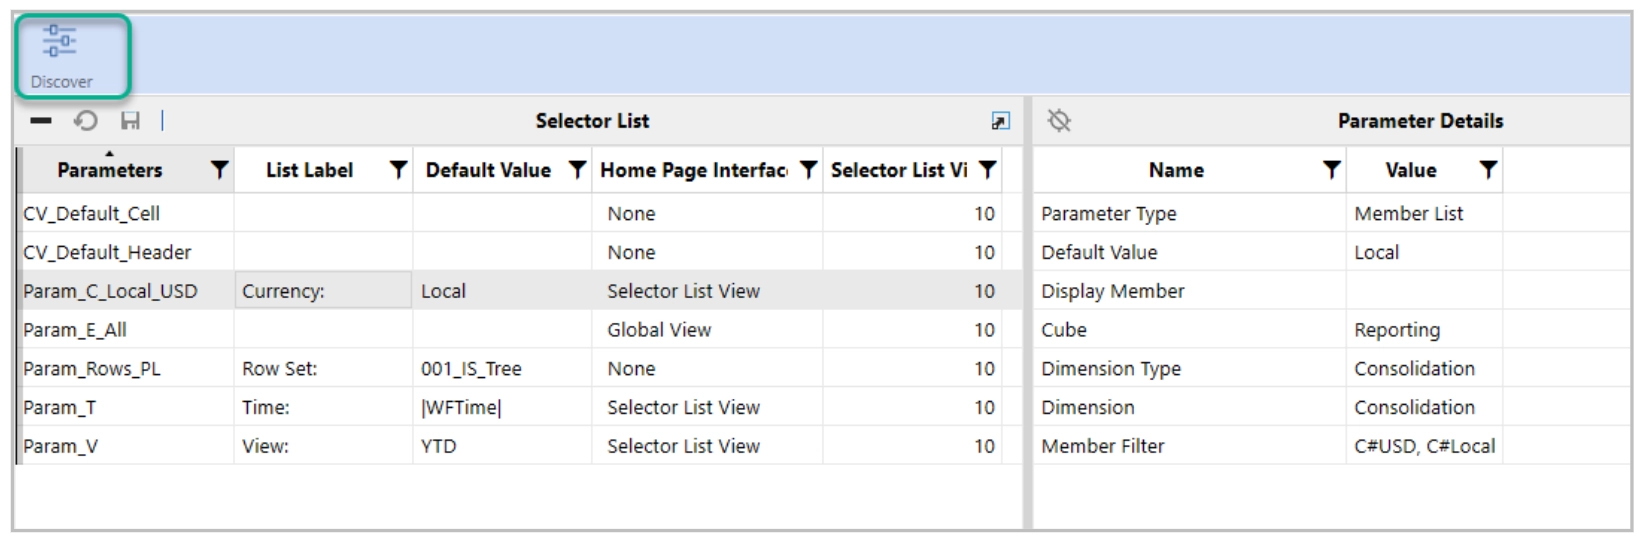
After adding a Cube View to a report group, click Discover to bring its parameters into Guided Reporting. This is where you replace technical names, such as Param_C_Local_USD, with labels users understand and set useful defaults.
Show Settings defines parameters shared across the Guided Reporting experience, while Discover identifies parameters associated with one Cube View. If the underlying Cube View parameters change, run Discover again so Guided Reporting reflects the latest configuration.
Configure a Parameter With a Variable
Defaults do not have to be static. Variables can make the reporting experience more intuitive.
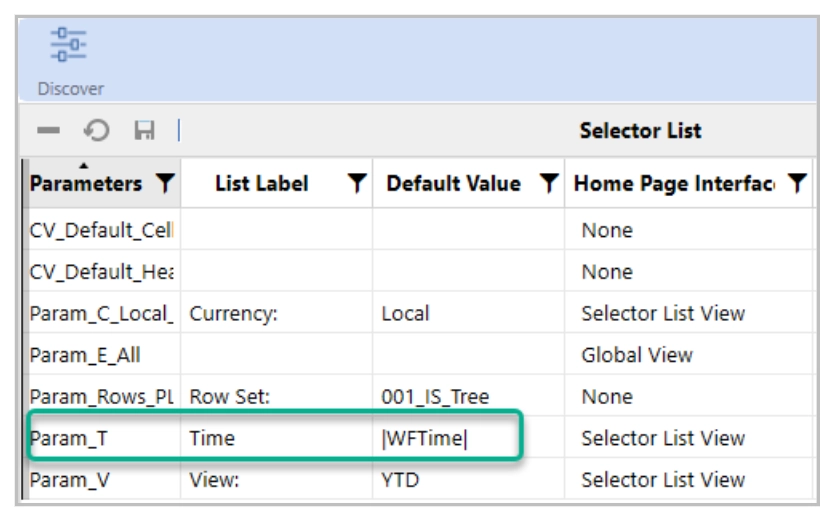
For example, an Income Statement may use a time parameter called Param_T. Assign the List Label Time, then configure the parameter to use a variable based on the current Workflow Time |WFTime|.
Guided Reporting will then automatically display the current Workflow Time when the report opens. If the workflow moves to a different period, the report updates accordingly.
This small configuration change removes a repetitive step for users.
Make Existing Report Options Available
Guided Reporting carries through the flexibility already built into a Cube View. In our Balance Sheet example, users can choose a Row Set and Column Set to switch between layouts without needing a separate Cube View for every combination.
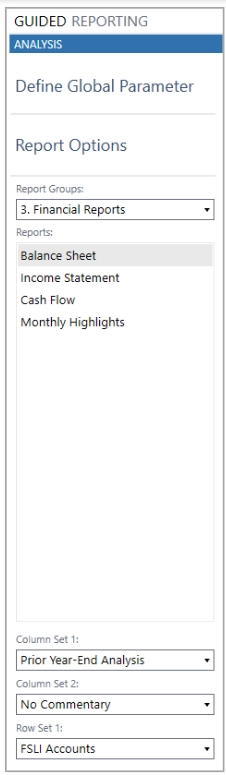
These sets and their supporting parameters are configured in the underlying Cube View, which also controls report actions such as Consolidate, Translate and Calculate.
Dashboards Belong Here Too
The same reporting group can also contain Dashboards. In Report Management, add a new report, set the Type to Dashboard, and select the dashboard in the Dashboard Name field. Leave Cube View Name unassigned.
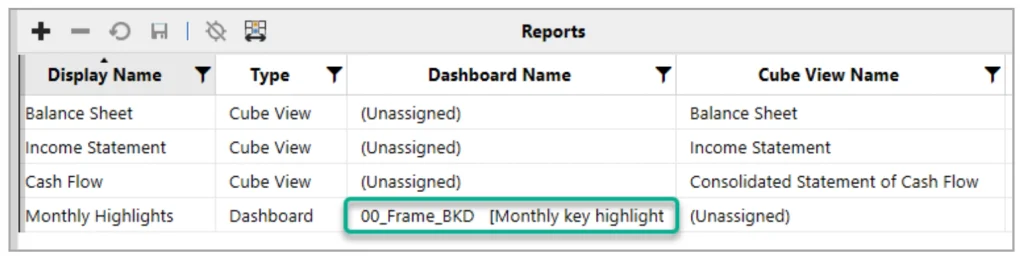
In the example below, Monthly Highlights is configured as a Dashboard, allowing users to access it alongside their financial reports from the same reporting page.
Final Thoughts
A successful Guided Reporting setup is less about creating new reports and more about bringing the reporting experience together.
Start with Show Settings Page to establish the global parameters. Use Report Management to organize and secure the content. Run Discover to connect individual Cube View parameters, then use friendly labels, defaults, and variables to make those selections intuitive for users.
And when a report does something unexpected, remember the most important distinction: Guided Reporting presents. The underlying Cube View or Dashboard defines.
Understanding which layer controls what makes Guided Reporting easier to configure, easier to troubleshoot, and ultimately easier for users to navigate.
Want to learn more? Book a demo with Black Diamond Advisory here.