
In Part 1 of this series, we covered the power of Application Reports in giving admins and power users clear insights into system configurations. Now, let us shift gears to another tool we always install: the System Diagnostics tool.
When it comes to maintaining a stable and high-performing OneStream environment, this tool is a non-negotiable for us. It helps us and our clients move from a reactive to a proactive admin mindset.
Why OneStream Diagnostics is Critical
No matter how well your application is built, issues like data unit size, storing zeros, and incorrectly written business rules can disrupt operations. The System Diagnostics Tool helps you catch and address these problems before they create downstream headaches.
We rely on this tool to give both us and our clients confidence that the application is both healthy and functioning as intended and to identify areas where small fixes can prevent big disruptions.
Key Benefits
- Automated Health Checks: Run automated scans across your application to identify potential risks before they impact operations. It is like having a built-in system whisperer that tells you when something feels off before your users start emailing you about it.
Application analysis provides insights into key metrics in an easy-to-use stoplight view.
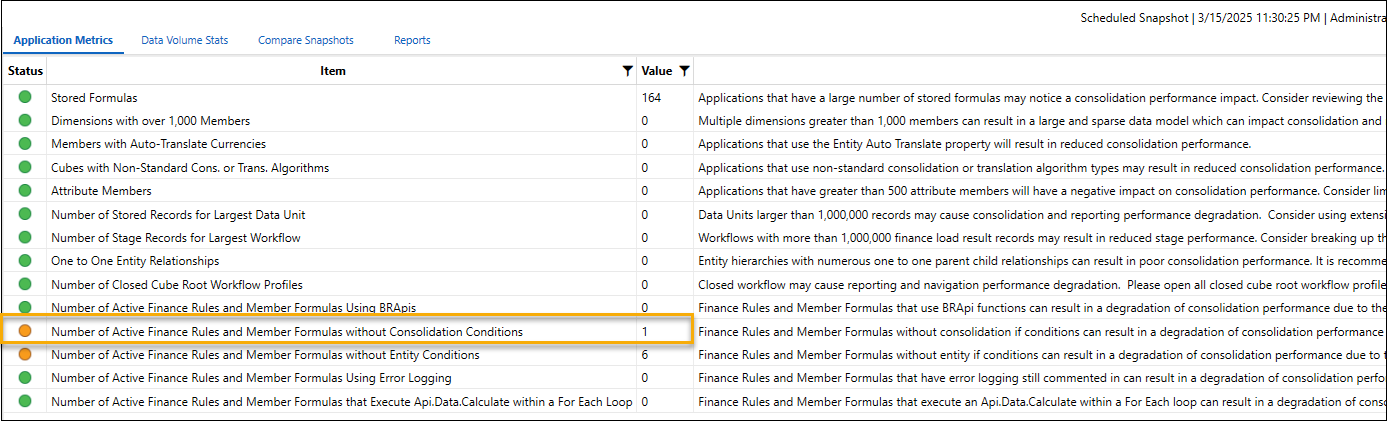
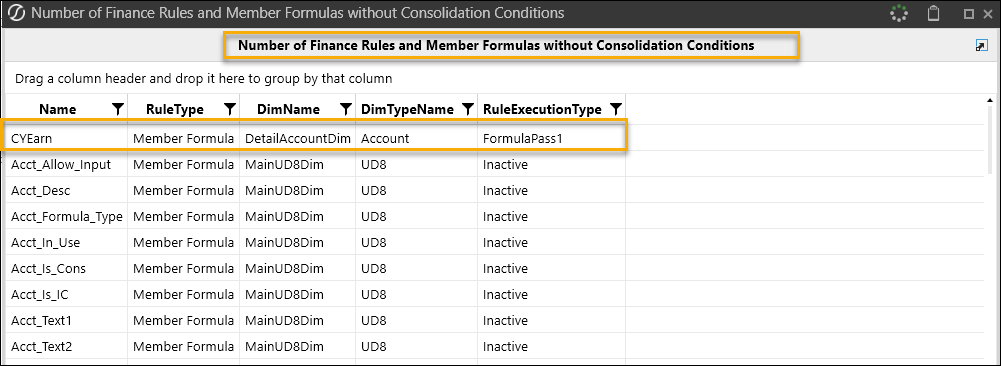
Clicking on an item gives you deeper insight into the areas of the application causing the flag. This is an area we monitor regularly throughout the live cycle of our builds.
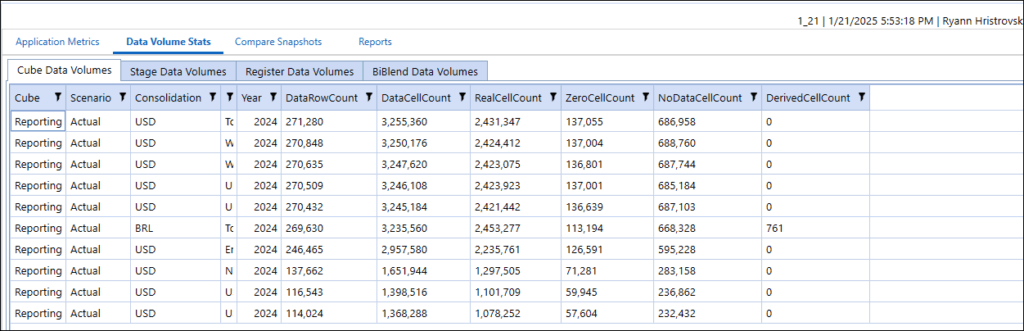
You can also view data details including zero cell counts over time, this is a metric to keep an eye on to ensure it is not growing exponentially. If you see high growth here over time this is cause for investigation.
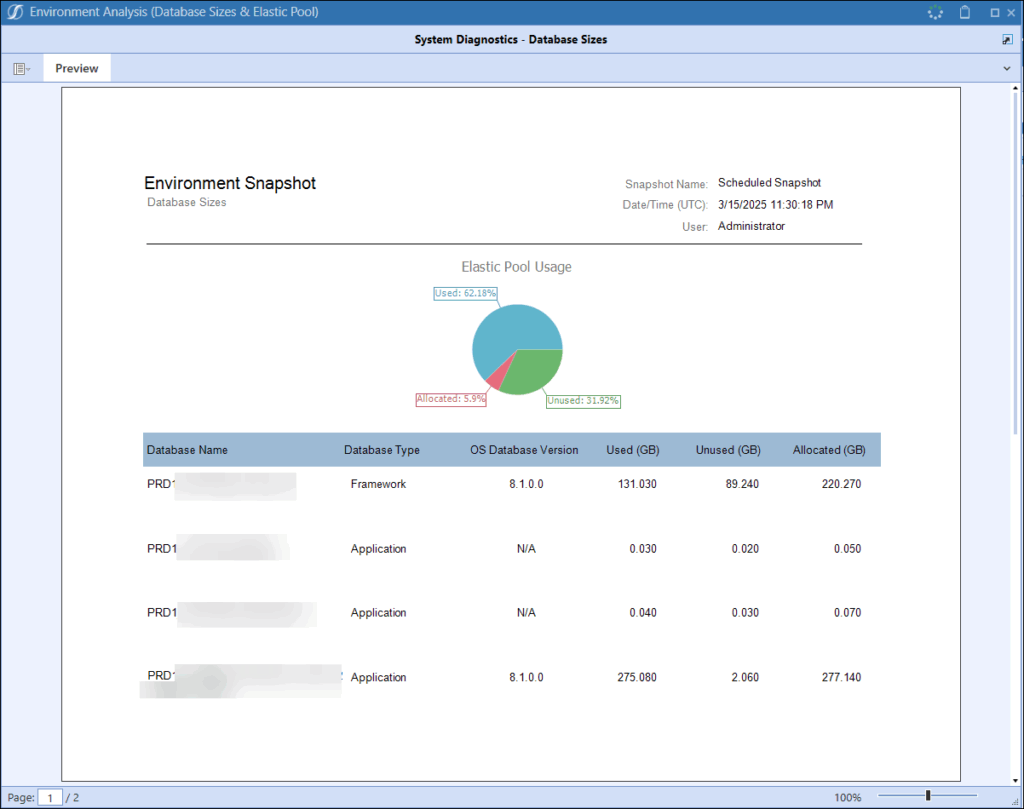
- Detailed Environment Snapshot Analysis: Gain a full view of your environment with snapshot reports across both application and database servers—perfect for audits, troubleshooting, or upgrades.
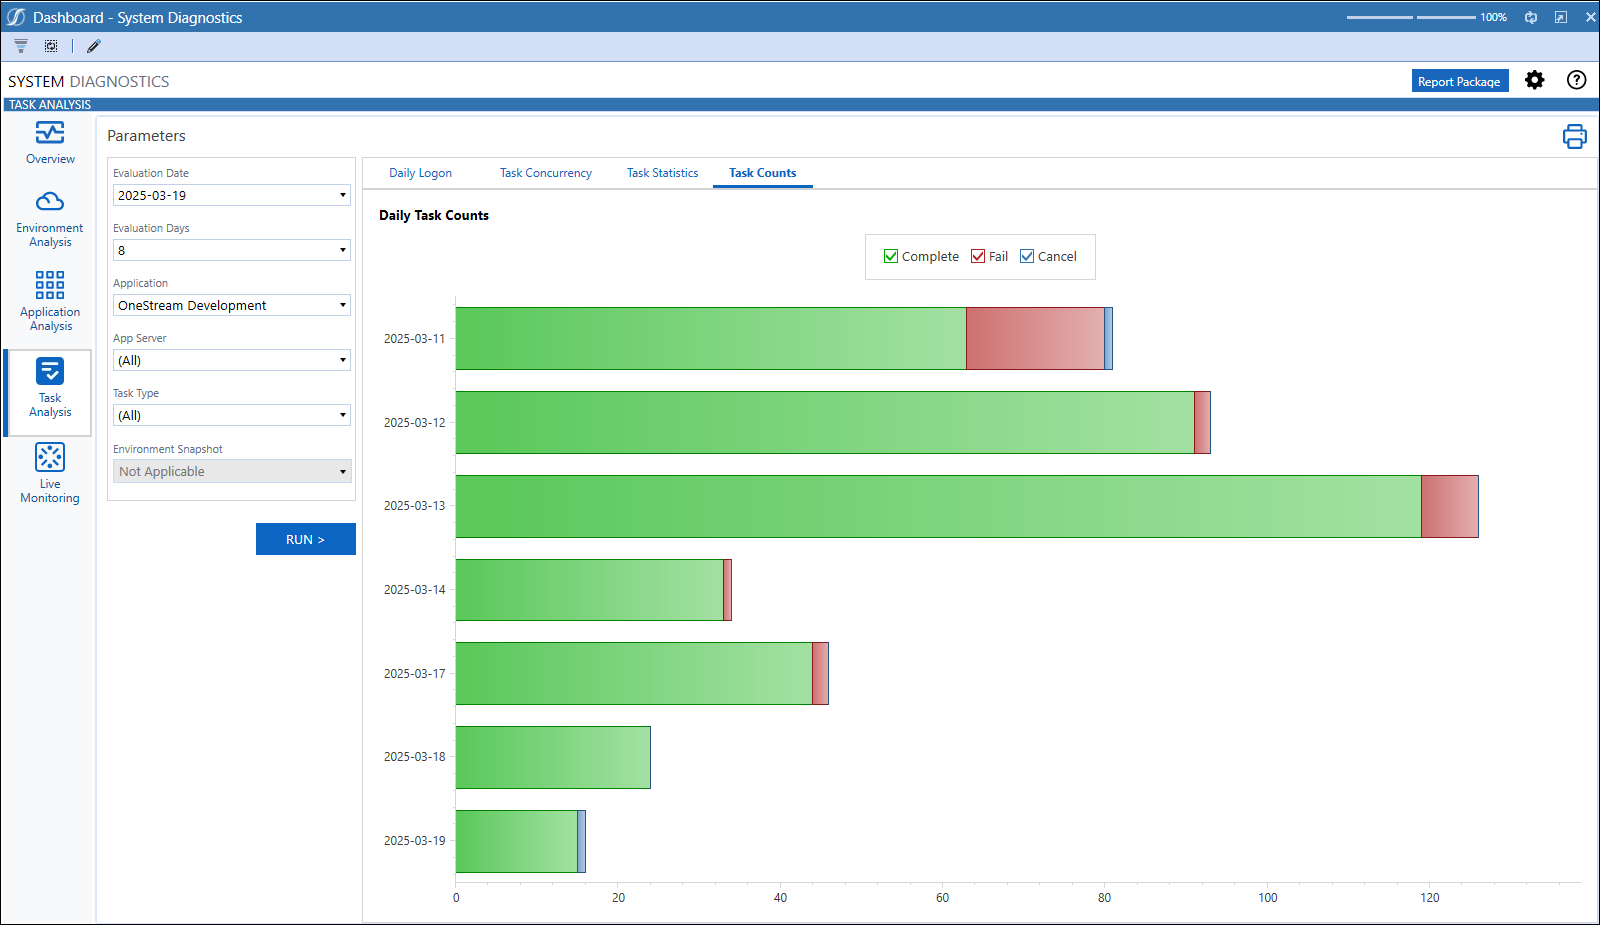
- Task Analysis Dashboard: Access insights into task execution, including concurrency metrics, task counts, and execution statistics to optimize job scheduling and system load.
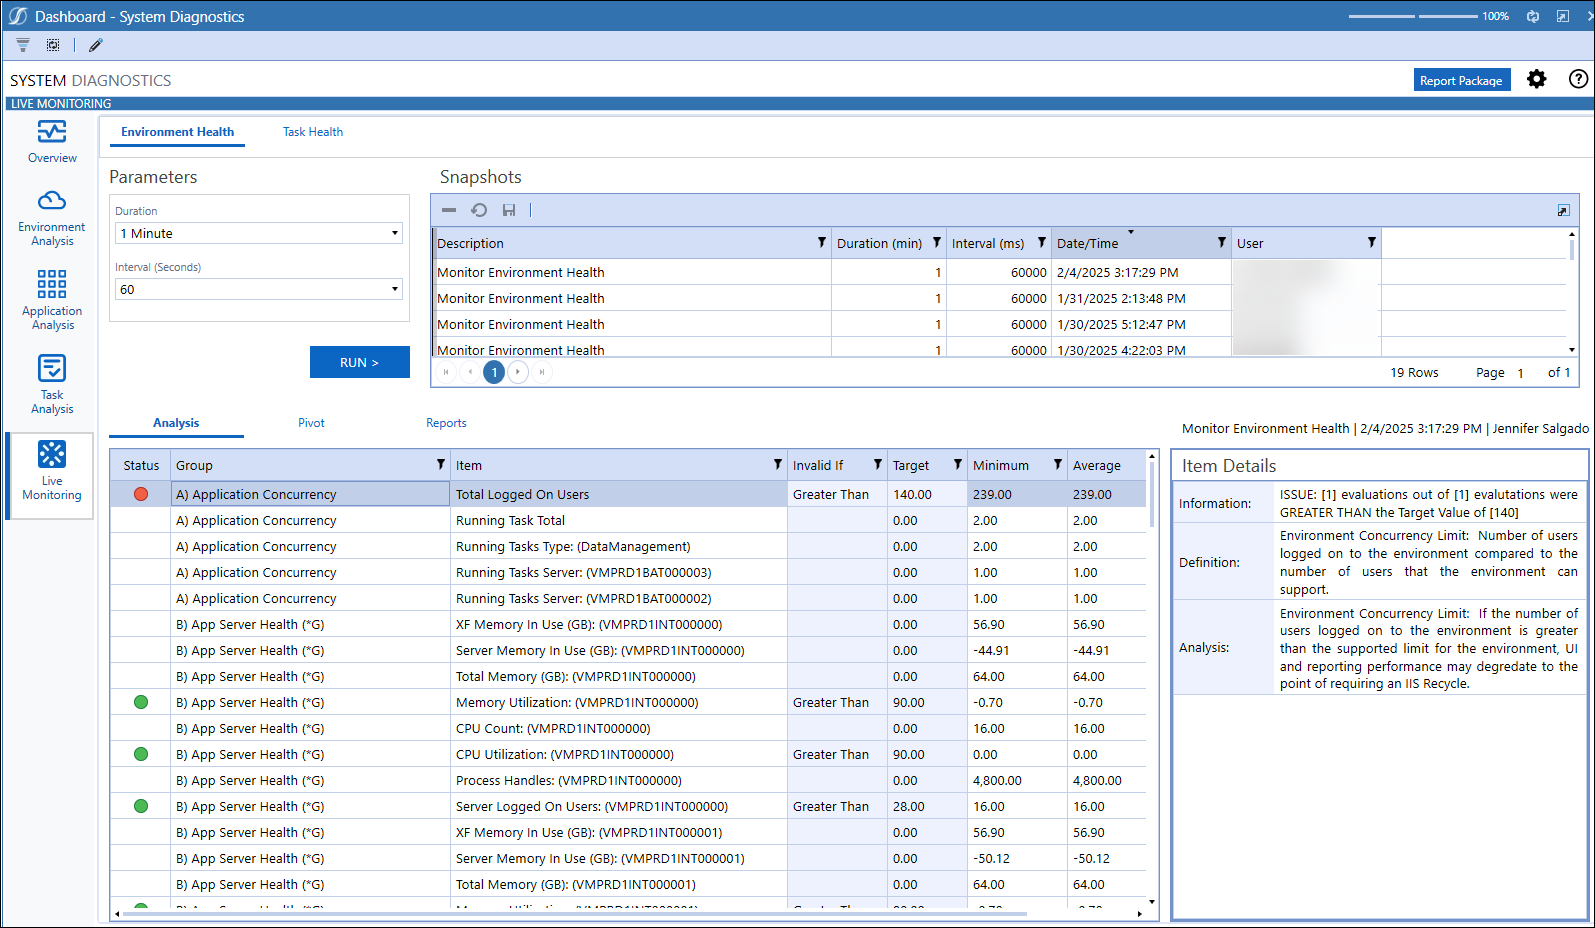
- Live Monitoring: Monitor your application and database servers in real time to proactively address performance bottlenecks or system strain before users feel the impact. Note: For cloud customers, Live Monitoring data may not always reflect real-time or fully accurate information. Please use it with discretion.
- Streamlined Troubleshooting: Save time investigating issues with centralized diagnostics and actionable recommendations.
How We Use It
Diagnostics is part of every build and ongoing maintenance cycle we deliver. We recommend using it:
- During development and UAT to ensure no configuration gaps exist before go-live.
- Post-go-live health checks to maintain system integrity as your application evolves.
- Before major upgrades, enhancements, or application reviews to catch potential issues early.
It is also a valuable coaching tool for internal admin teams, helping them take ownership of ongoing system health.
Why It Matters
No one wants to be the admin who find out about issues in panicked Teams messages at 8am! The System Diagnostics Tool is more than a simple health check. It is your partner in keeping OneStream applications running smoothly.
From system-wide snapshots to real-time monitoring and task-level insights, diagnostics helps admins stay ahead of issues, optimize performance, and ensure a reliable experience for users. By integrating this tool into your routine maintenance and governance processes, you create a safer, more efficient environment that is ready to scale and evolve with your business.
Next Up: Part 3
Stay tuned for Part 3, where we will dive into the Cloud Administration Tool—your cloud-based command center for managing applications, and security keys.